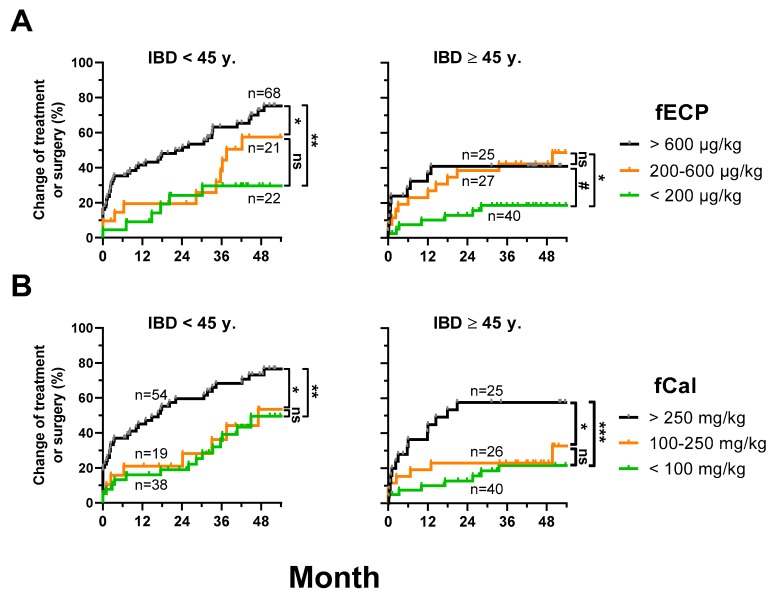
Figure 2.
fECP as a predictive marker in IBD. Inverse Kaplan–Meier curves for time to treatment modification (only immunosuppressants and biologics) or surgery during follow up depending on (A) different levels of fECP and (B) different levels of fCal at baseline. p-values were calculated with log-rank (Mantel–Cox) test. ns (non-significant), p > 0.07; #, p ≤ 0.07; *, p < 0.05; **, p < 0.01; ***, p < 0.001.

