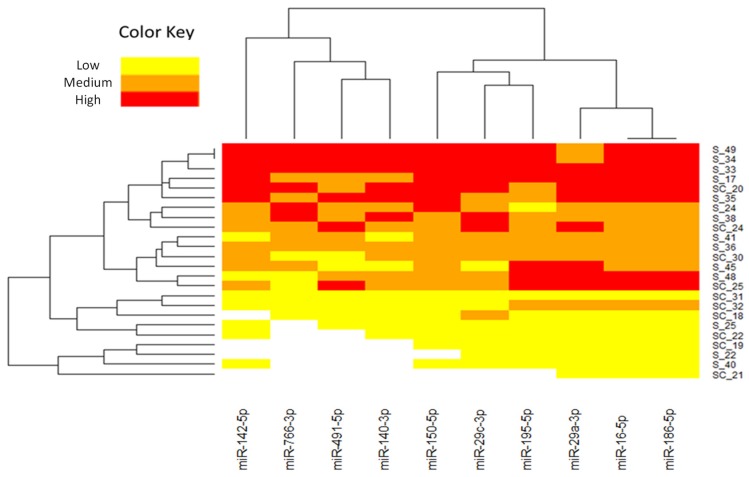
Figure 1.
Hierarchical clustering heatmap of 10 miRNAs selected for the validation phase with a > 1.5-fold change difference (p < 0.05) between CRC patients and healthy controls. Each row represents one sample and each column represents the expression profile of a single miRNA. The relative miRNA expression changes are expressed by three colors from red to yellow, as shown at the top, where red represents the high expression, orange medium expression, and yellow low expression. The miRNA clustering tree is shown on the top and the sample clustering dendrogram is presented on the left. S1–S12 correspond to salivary samples of CRC patients and SC1–SC10 correspond to salivary samples of healthy controls. Note: miRNAs, microRNAs; CRC, colorectal cancer.

