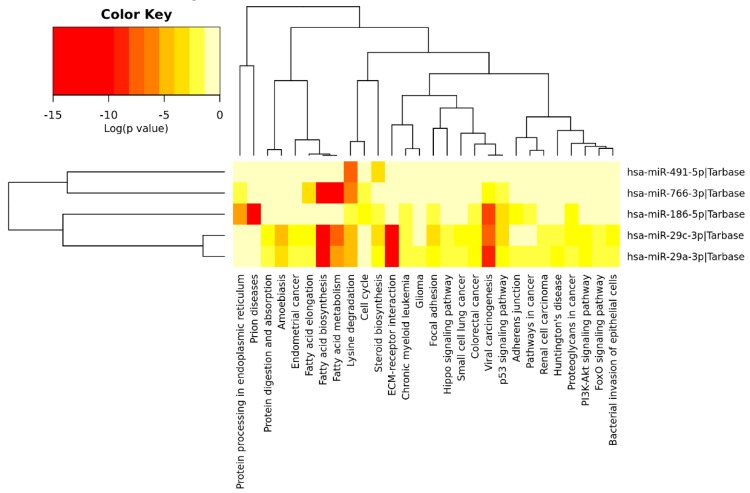
Figure 6.
Heatmap of differentially expressed miRNAs vs. significantly enriched functional pathways. In the heatmap, the hottest colors depict higher statistical significance as indicated by the color key at the above. The attached dendrograms on both axes represent hierarchical clustering results for miRNAs and pathways, respectively. Figure was obtained from the output of Diana miRpath V.2.

