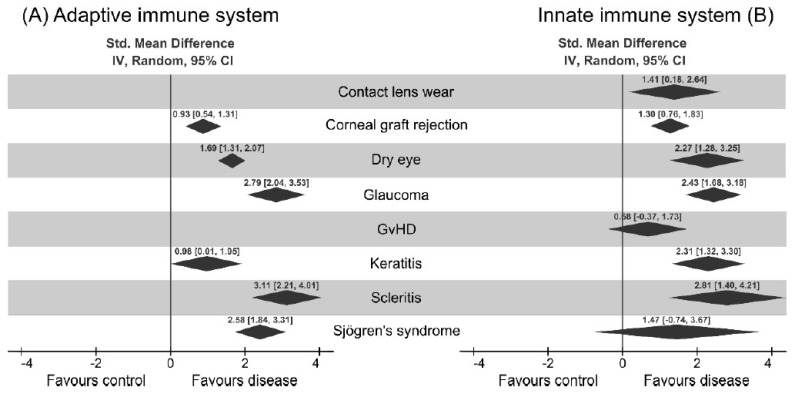
Figure 2.
Analysis of different immune cell components in the eight chosen ocular surface diseases. The global standard mean difference for each disease obtained by our proposed meta-analysis is shown as a part of adaptive immune system (A) and innate immune system (B). The diamonds represent the standard mean difference and the 95% confidence interval for each disease. It can be seen that the presence of immune cells is higher for every analyzed disease. A detailed description of each of the diseases and the different cells involved can be found in the Supplementary Material (Supplementary Figures S1–S8).

