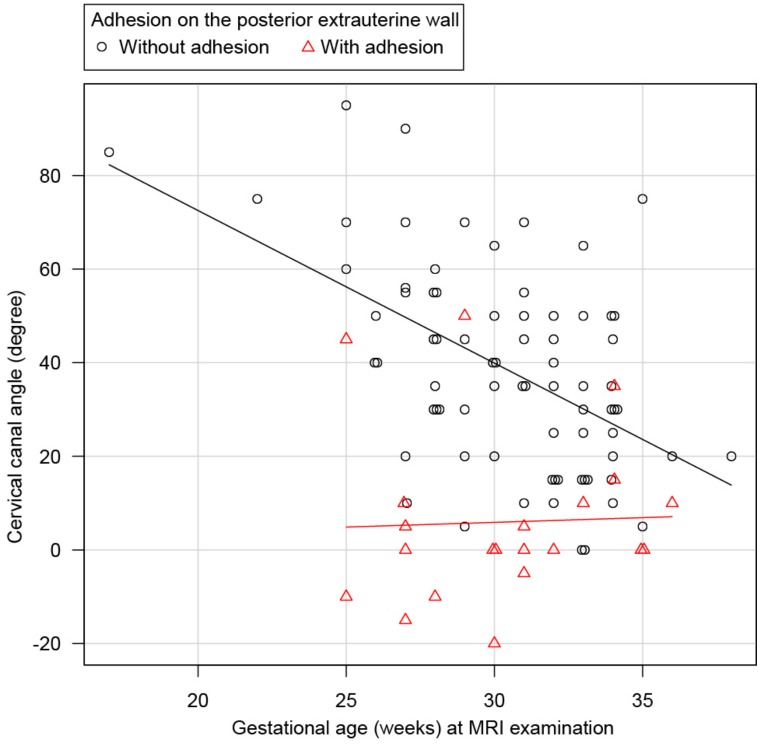
Figure 5.
The statistical analysis of continuous variables of the cervical canal angle. A scatter plot diagram of the data obtained from 96 pregnant women who underwent MRI. The vertical axis presents the cervical canal angle and the horizontal axis presents the number of gestational weeks at MRI examination. ○ represents patients without posterior extrauterine wall adhesion and △ represents patients with posterior extrauterine wall adhesion. The approximate lines for the two groups of patients are indicated. The approximate line for the non-adhesion group showed that the cervical canal angle significantly decreased by 3.3° per week, whereas the approximate line for the adhesion group was 0°, indicating no significant change.

