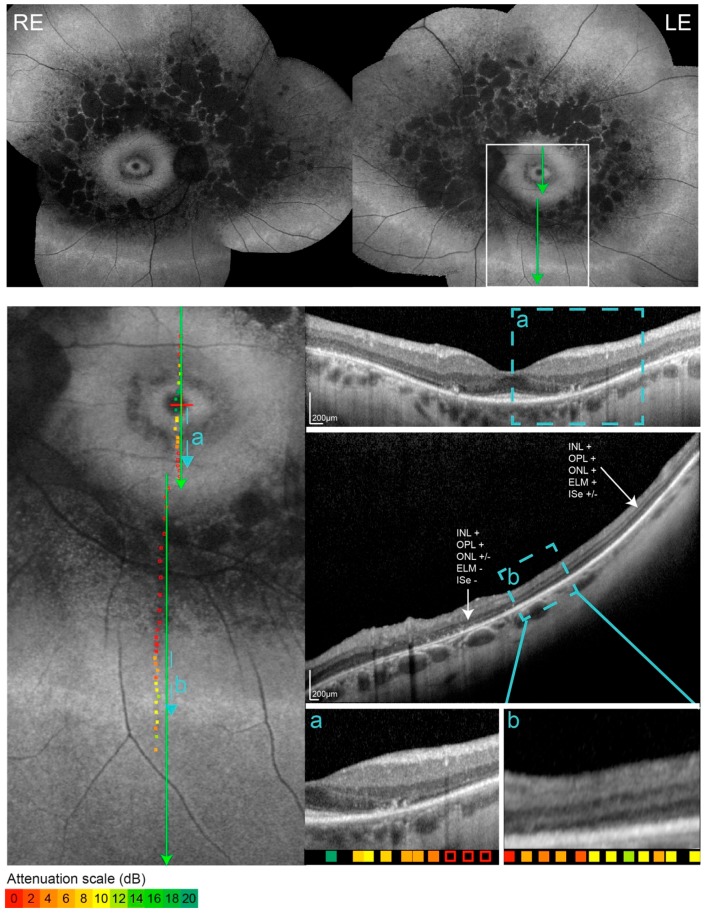
Figure 3.
FAF, OCT and overlaid microperimetry of Patient 1. Retinal sensitivity is color-coded from green (good) to red (poor), with empty squares representing no response to the brightest stimuli. The location of each OCT scan is marked with green lines. The areas of transition trough the hyperautofluorescent borders are marked with blue lines and enlarged in rectangles a and b. The outer hyperautofluorescent ring was most accessible to the OCT imaging in the inferior retina. Panel b shows the re-appearance of the external limiting membrane at the location of the outer ring.

