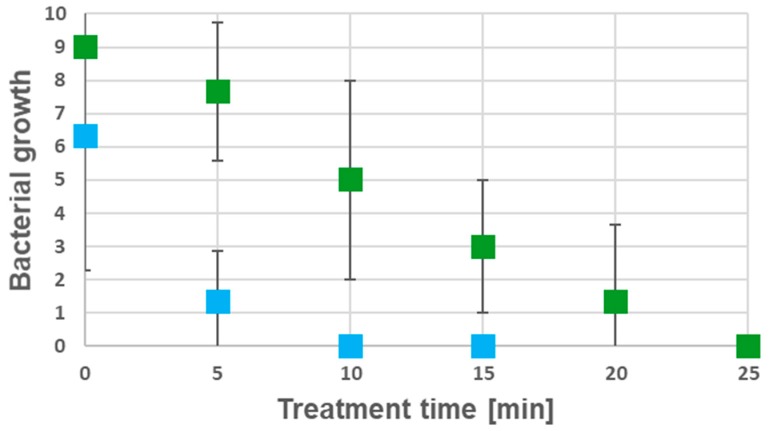
Figure 9.
Disinfection kinetics of prototype 2 electrodes. Growth of B. subtilis and S. epidermidis dependent on treatment time is shown (bacterial growth is indicated as numbers of contaminated imprints showing bacterial growth after overnight incubation; color coding: B. subtilis: green, S. epidermidis: blue.) Each set of experiments was carried out in three independent biological replicates (n = 3) and each square shows the mean of the corresponding data (± standard deviation).

