
Figure 3.
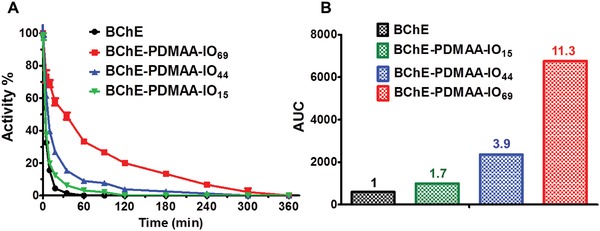
A) Inhibition assay of BChE and BChE‐PDMAA‐IO conjugates by 3.2‐fold stoichiometric excess of POX at pH 7.4 for 360 min. Results are presented as mean values ± standard deviation (n = 3). B) Area under the curves in subplot (A).
Official websites use .gov
A
.gov website belongs to an official
government organization in the United States.
Secure .gov websites use HTTPS
A lock (
) or https:// means you've safely
connected to the .gov website. Share sensitive
information only on official, secure websites.
A) Inhibition assay of BChE and BChE‐PDMAA‐IO conjugates by 3.2‐fold stoichiometric excess of POX at pH 7.4 for 360 min. Results are presented as mean values ± standard deviation (n = 3). B) Area under the curves in subplot (A).