
Figure 1.
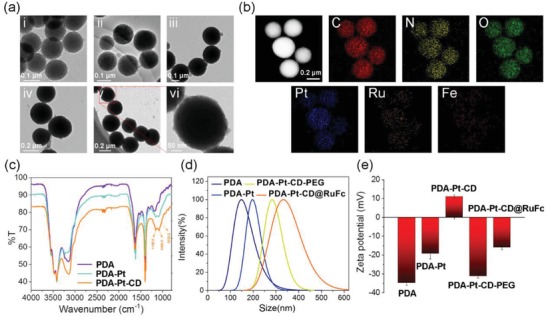
a) TEM image of: i) PDA, ii) PDA‐Pt, iii) PDA‐Pt‐CD, iv) PDA‐Pt‐CD‐PEG, and v) PDA‐Pt‐CD@RuFc NPs. vi) The detailed picture of (v). b) TEM elemental mapping of PDA‐Pt‐CD@RuFc NPs. c) The IR spectra of PDA, PDA‐Pt, and PDA‐Pt‐CD NPs. d) The particle size distributions of PDA, PDA‐Pt, PDA‐Pt‐CD‐PEG, and PDA‐Pt‐CD@RuFc NPs. e) The zeta‐potentials of PDA, PDA‐Pt, PDA‐Pt‐CD, PDA‐Pt‐CD‐PEG, and PDA‐Pt‐CD@RuFc NPs.