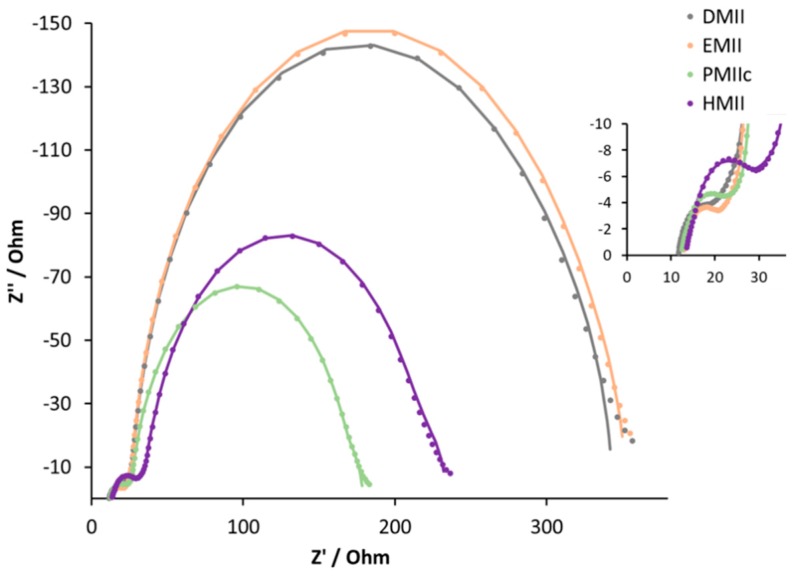
Figure 11.
Nyquist plots of the DSCs with electrolytes DMII, EMII, PMIIc, and HMII. Data for multiple DSC sets are shown in Figures S15–S18 (see Supporting Information). Solid lines represent fitted curves and dotted lines represent experimental data. The expansion shows the high frequency region.

