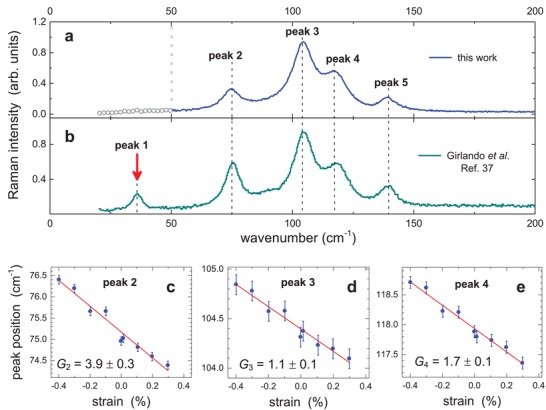
Figure 3.

Low‐frequency region of Raman spectra of rubrene as a function of uniaxial strain. a) Raman spectrum of a thin rubrene crystal with the resolved peaks 2–5, marked by the thin dotted lines. Our spectrometer's resolution cutoff is at ≈50 cm−1, below which peaks cannot be resolved (indicated by the dotted gray line). b) Raman spectrum of a rubrene crystal reproduced for comparison from Girlando et al.37 The lowest‐energy mode at 35 cm−1 (peak 1) is indicated by the red arrow. c–e) The dependence of the position of Raman peaks 2 (75 cm−1), 3 (104.5 cm−1), and 4 (118 cm−1) on strain applied along the high‐mobility b‐axis of rubrene. Compressive and tensile strains correspond to the negative and positive values, respectively. The solid red line is a linear fit, and the Grüneisen parameter, G, calculated from these fits via Equation (3) is indicated.
