Figure 1.

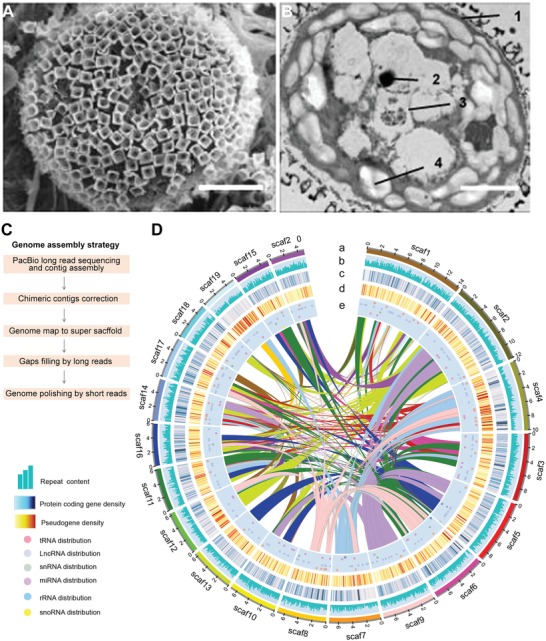
M. viride morphology and genome assembly. A) Scanning electron micrograph of M. viride cell surface shows its unified basket‐like scales. Scale bar, 2.5 µm. B) Ultrastructure of a M. viride cell observed under transmission electron microscope. 1, cytoderm; 2, pyrenoid; 3, eyespots; 4, starch granule. Scale bars, 2.5 µm. C) The assembly of the M. viride genome combines PacBio long reads, Illumina short reads, and optical map generated from Saphyr System. D) Circos plot depicting the genome content based on the 20 longest scaffolds in a 200 kb nonoverlapping window. Numbers on the circumference are at the megabase scale. “a” track represents the 20 longest scaffolds of M. viride, while the distribution of repeat b), gene c), pseudogene d), and ncRNA e), including tRNA, lncRNA, snRNA, miRNA, rRNA, and snoRNA, are indicated in the other tracks. Linked lines in the middle of the Circos plot connect syntenic blocks (minimum five gene pairs) from the most recent segmental duplication events. Different colors were used to distinguish different scaffolds a) or syntenic blocks (linked lines).
