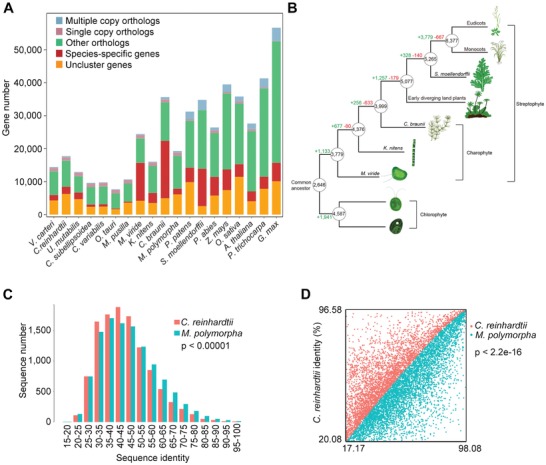
Figure 2.

Evolutionary analysis of M. viride with other selected green plant species. A) Gene family clustering statistics. The M. viride genome contains a large portion of species‐specific genes, which represent those belonging to a gene family that only exists in a particular species. Multiple and single copy orthologs include the common orthologs with different copy numbers in the species studied. Other orthologs include unclassified orthologs, whereas unclustered genes include those that are not assigned into any gene families. B) Gene family gains (+) and losses (−) mapped onto the plant phylogenetic tree. The minimum numbers of gene families present in the ancestors of different plant lineages are circled. Branch lengths are arbitrary. The analysis includes all the species in (A), only the representative species for each lineage are shown in the schematic diagram. C,D) Frequency distribution with Chi‐square test (C) and scatter plot with two‐sample Kolmogorov–Smirnov test of protein sequence identity (D) between 11 239 homologous gene pairs of M. viride versus C. reinhardtii and M. viride versus M. polymorpha. Only 1:1:1 common orthologs of M. viride, C. reinhardtii, and M. polymorpha were considered. There is a significantly higher identity between homologous gene pairs in M. viride versus M. Polymorpha. Red or blue represents the sequence identity between M. viride and C. reinhardtii or between M. viride and M. polymorpha, respectively.
