Figure 5.

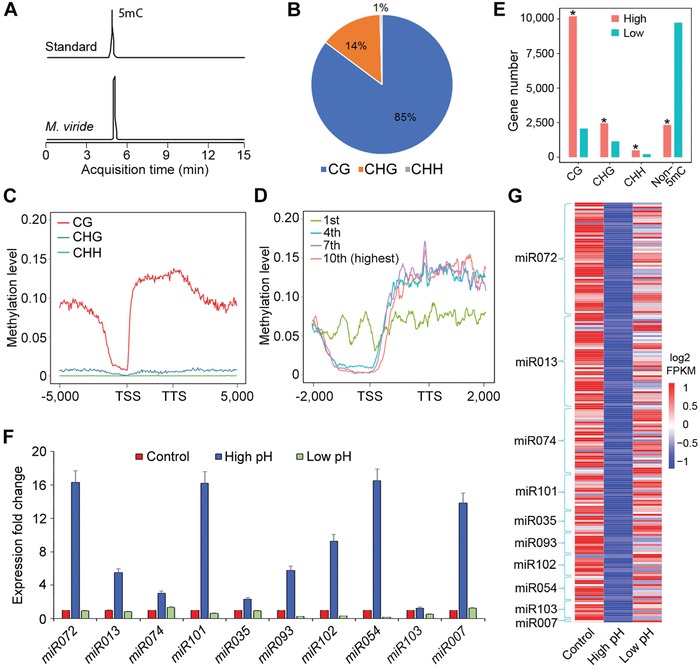
Epigenetic and miRNA regulation in M. viride. A) Ion chromatograms for 5mC nucleoside standard and 5mC nucleosides in genomic DNA purified from M. viride. B) Pie chart showing the composition of 5mC methylation motifs with CG as the major methylation site in M. viride. C) The average methylation levels of genes (including 5000 bp upstream of TSS and 5000 bp downstream of TTS) for each 100 bp interval plotted. D) Methylation levels of genes grouped into deciles based on expression levels (fragments per kilobase of transcript per million mapped reads, FPKM). The levels for four deciles (from the lowest first to the highest tenth) are shown. E) List of the numbers of 5mC‐methylated genes with high (FPKM ≥ 1) and low (FPKM < 1) expression levels. Asterisks indicate statistically significant differences in the numbers of methylated genes between highly and lowly expressed genes (Chi‐square test, p < 10−5). F) qPCR analysis of ten randomly selected pri‐miRNA in samples cultured under different pH conditions. Gene expression levels in the control are set as 1. Error bars, mean ± SD; n = 3 biological replicates. G) Heat map showing the expression of miRNA target genes extracted from the RNA‐seq data. Their expression negatively correlates with the expression of their corresponding pre‐miRNAs (F) under different pH conditions.
