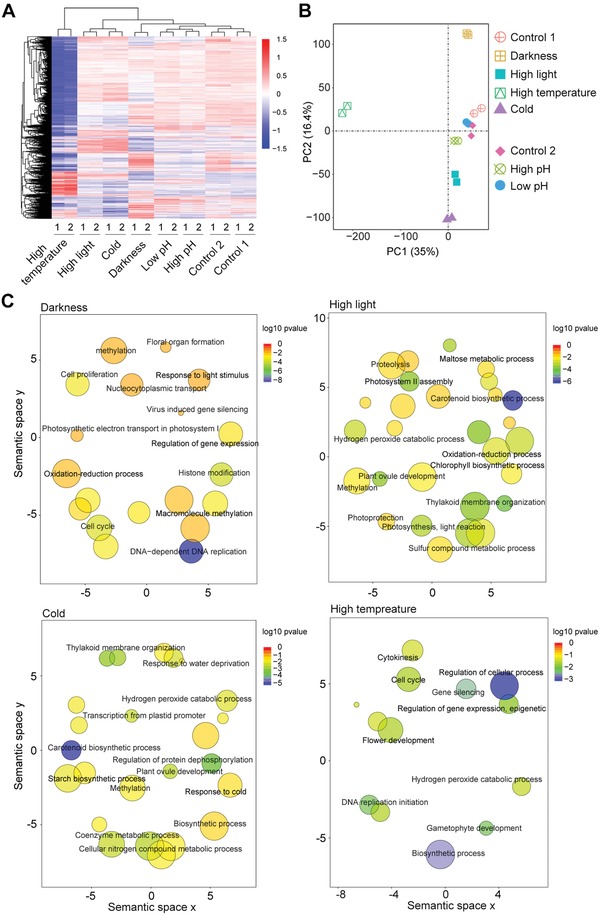
Figure 6.

Transcriptome profiles of M. viride cultured under different environmental conditions. A) Heat map showing differentially expressed genes (p < 0.01, fold change > 2) under different light intensity, temperature and pH compared to optimal growth conditions as indicated in Methods. Two biological replicates were included for each treatment. Samples cultured under different light intensity and temperature conditions were compared with Control 1, while those cultured under different pH conditions were compared with Control 2. B) Principal component analysis of RNA‐seq data derived from samples cultured under different conditions. Axis percentages indicate variance contribution. C) Scatter plots of significant biological processes as determined by GO enrichment analysis of differentially expressed genes (DEGs) under different light intensity and temperature. The size of the circle is proportional to the number of DEGs.
