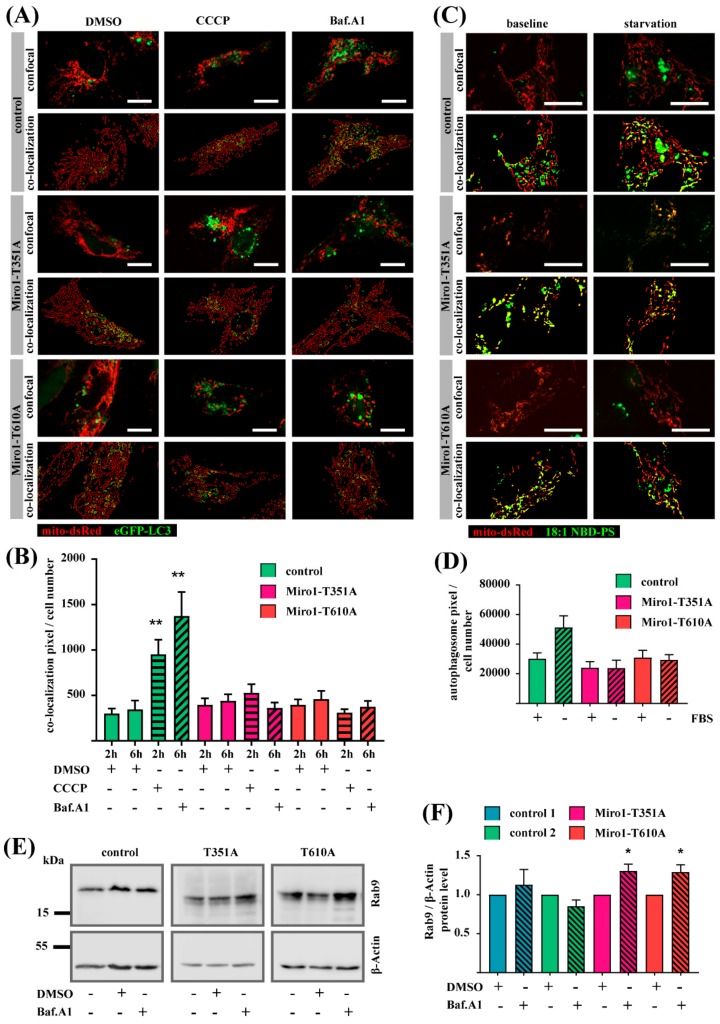
Figure 6.
(A) Fibroblasts were transfected with mito-DsRed and eGFP-LC3 and treated with 25 µM CCCP for 2 h or with 10 nM BafilomycinA1 for 6 h. Microscopy images were obtained with a 40× objective. In the co-localization panel, the mitochondria are indicated in green and the LC3 puncta are indicated in red. Co-localization events of mitochondria and LC3 puncta are indicated in yellow. Scale bars indicate 20 µm. (B) Quantification of co-localization events of mitochondria and LC3 puncta from (A) normalized to cell number. Significance was calculated using the Mann-Whitney test (n = 3; ~24 cells analyzed per fibroblast line, per condition and per experiment). (C) Fibroblasts were transfected with mito-DsRed and after 24 h loaded with 18:1 NBD-PS. Fibroblasts were then starved without FBS for 2 h before live cell imaging, using a 63× objective. The co-localization panel shows mitochondria in red and 18:1 NBD-PS signal in green. Co-localization of mitochondria and 18:1 NBD-PS is indicated in yellow. Autophagosomes were identified as 18:1 NBD-PS signal, which did not co-localize with the mito-DsRed signal. (D) Quantification of autophagosomes from microscopy images shown in (C). Significance calculated with Mann-Whitney test (n = 3; 10 cells analyzed per line, condition and per experiment). (E) Western blot image of Rab9 and β-Actin in immortalized fibroblasts. (F) Quantification of relative Rab9 protein levels normalized to β-Actin. Significance calculated by Mann-Whitney test (n = 4–6). All data indicated as mean ± SEM. * p < 0.05; ** p < 0.001.

