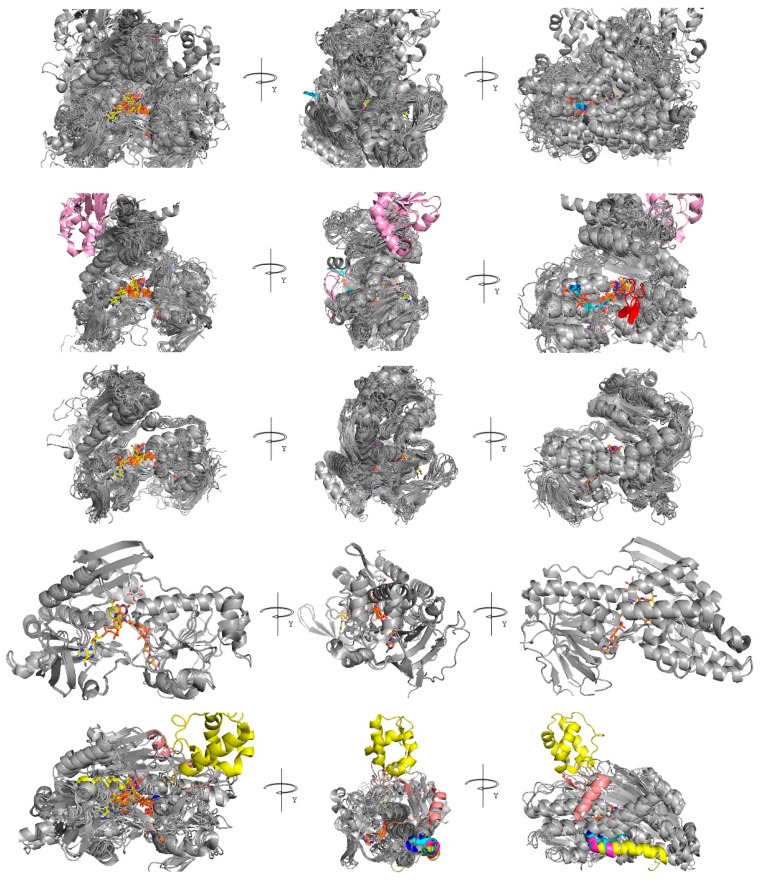
Figure 4.
Comparative analysis of AIF/NDI/NDH-2/DLD structures. First row: Superimposition of all the sampled 49 crystallized structures (see Table 1). Second to fifth row: superimposition of all the AIF-like proteins, DLD-like proteins, NDI-like proteins, and NDH-2-like proteins, respectively. All the sampled proteins are reported as grey cartoon representations. Specific protein features are colored according to what is reported in the main text at each row. FAD, NADH, UQ, and CoA are reported as orange, yellow, white, and cyan sticks, respectively, where available at the reported crystallized structures, according to Table 1.

