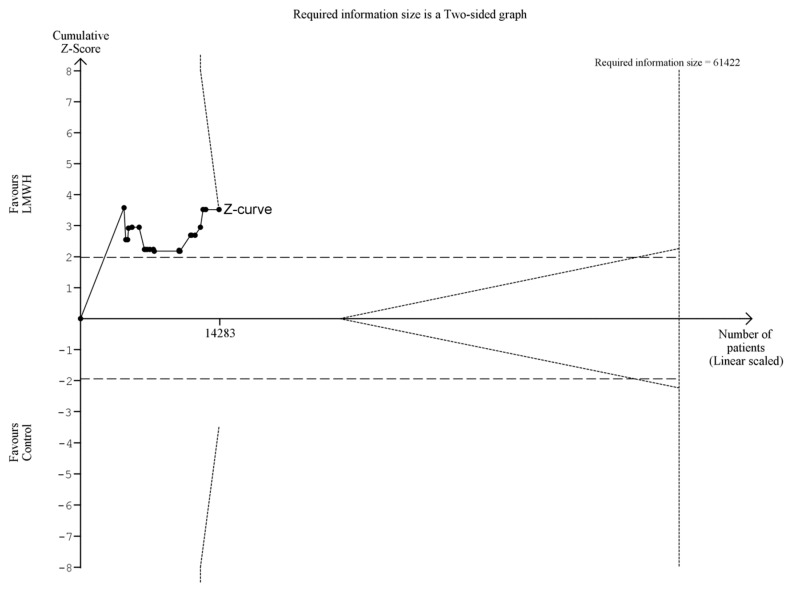
Figure 3.
Trial sequential analysis of symptomatic venous thromboembolism (VTE). Trial sequential analysis of symptomatic VTE at maximal follow-up of LMWH compared to placebo or no treatment. The required information size was calculated using α = 0.025, β = 0.90, relative risk reduction (RRR) = 20%, diversity (D2) as suggested by trials, and a control event rate of 1.81%. The cumulative Z-curve was constructed using a random-effects model, and each cumulative Z-value was calculated after inclusion of a new trial (represented by black dots). The dotted horizontal lines represent the conventional naïve boundaries for benefit. The etched lines represent the trial sequential boundaries for benefit (positive), harm (negative), or futility (middle triangular area). The cumulative Z-curve crosses the TSA boundary for benefit, indicating future trials are very unlikely to change the conclusions. Note: the two most recent trials were excluded from this TSA because inclusion would result in an incorrect graphical display of the LanDeMets boundary for benefit. The TSA-adjusted confidence interval remained similar.

