Figure 1.
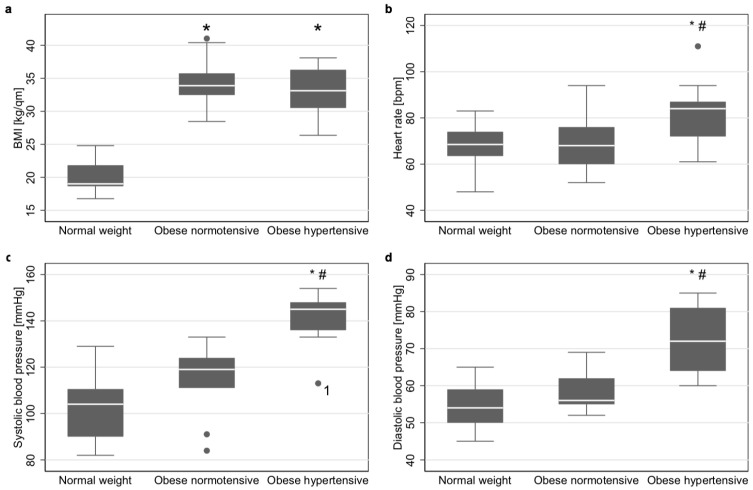
Group characteristics. (a) Boxplots of body-mass index (BMI) of controls, normotensive obese and hypertensive obese. (b) Boxplots of heart rate of controls, normotensive obese and hypertensive obese. (c) Boxplots of systolic blood pressure of controls, normotensive obese and hypertensive obese. (d) Boxplots of diastolic blood pressure of controls, normotensive obese and hypertensive obese. Tests were performed using a Kruskal–Wallis Test (N = 32) with inter-group p-values according to Bonferroni corrected Dunn’s test. * p-value < 0.05 compared to controls # p-value < 0.05 compared to normotensive obese. 1diastolic hypertension (above the 95th percentile).

