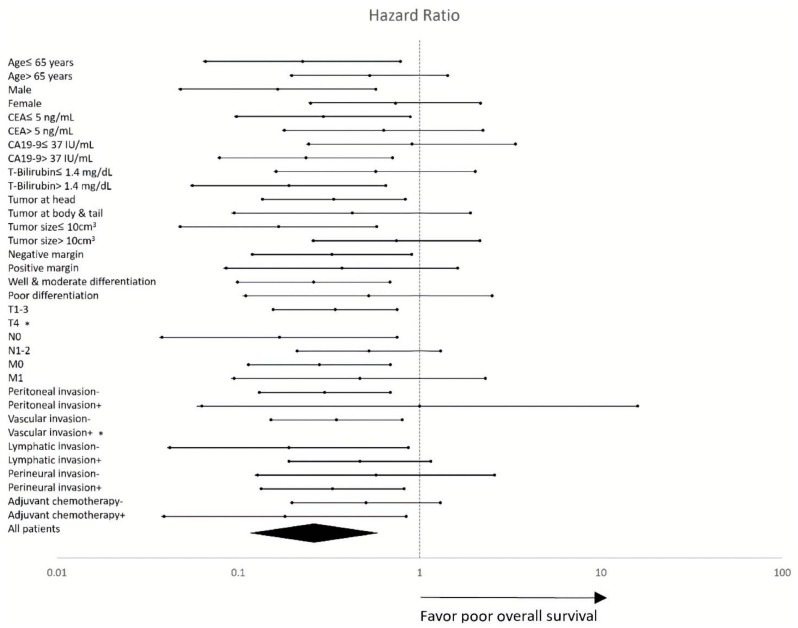
Figure 2.
Forest plot of HRs for the impact of the GALNT14 “GG” genotype on OS in different clinicopathological subgroups. The subgroup-specific HRs (95% CI) and p-values are detailed in Supplementary Table S1. *: No comparable event. Abbreviations: CEA = carcinoembryonic antigen, CA19-9 = carbohydrate antigen 19-9, T-bilirubin = total bilirubin, HR = hazard ratio, GALTN14 = N-acetylgalactosaminyltransferase14, OS = overall survival, and CI = confidence interval.

