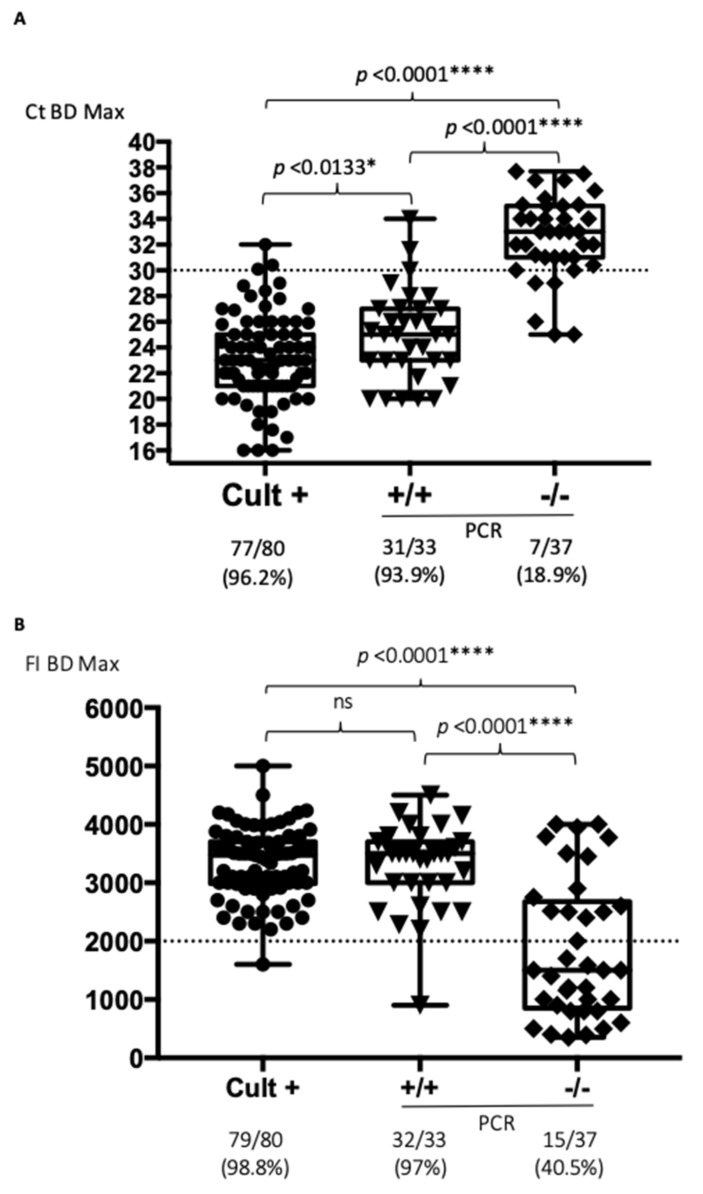
Figure 1.
Stratification of the BD MAXTM results according to culture results and Campylobacter sp. detection by independent PCR formats (* p < 0.05, and **** p < 0.0001, ns: non-significant). (A) Data analyzed according to the Ct values obtained on BD MAXTM; (B) Data analyzed according to the fluorescence intensity (FI) obtained on BD MAXTM. Cult+: positive Campylobacter cases; +/+: culture negative cases positive by two independent PCRs; -/-: double-negative cases. The doted lines correspond to the proposed cut-off for Ct or FI values.

