
Figure 2.
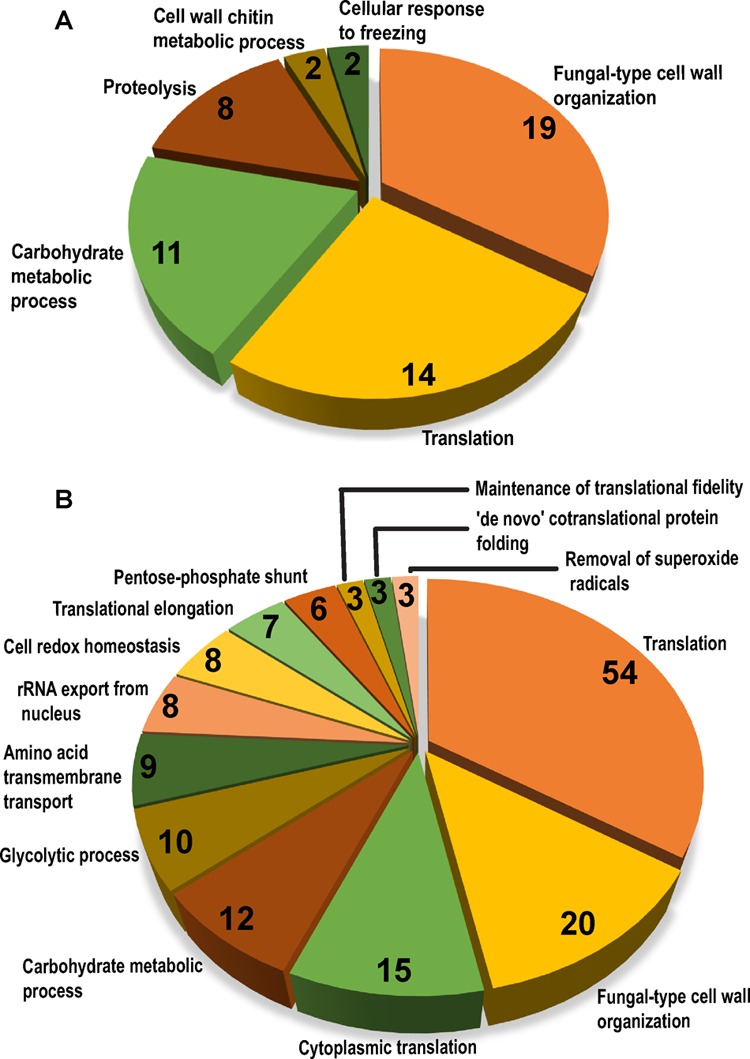
Functional enrichment analysis of secretomes. Pie chart illustrating enriched GO terms for biological process category in secretomes of wild-type (A) and Cgyps1-11Δ (B), as determined by the FungiFun tool. The number of proteins classified in each category are depicted inside pie slices.