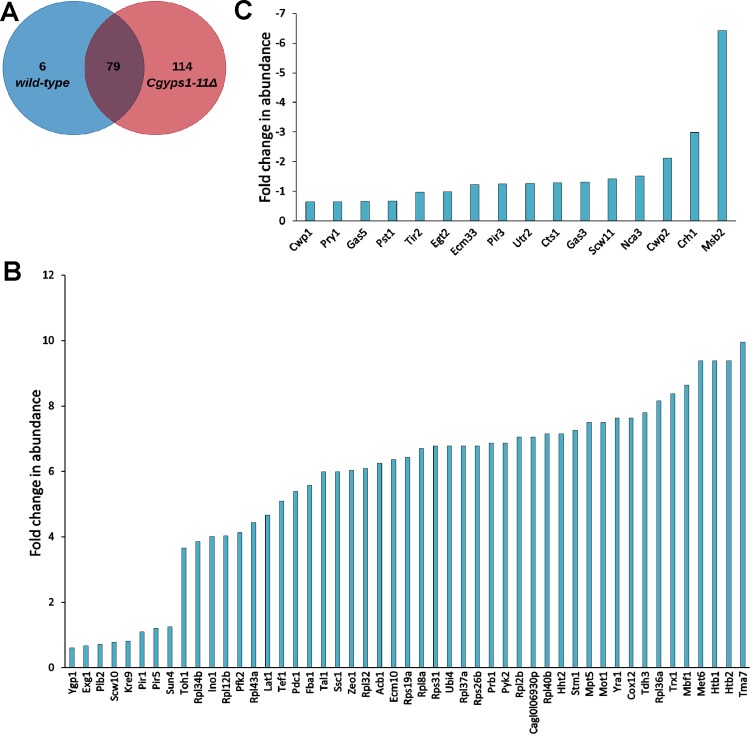
Figure 6.
Quantitative secretome analysis of C. glabrata. (A) Venn diagram illustrating overlap in proteins identified in the quantitative secretomes of wild-type and Cgyps1-11Δ strains. (B) Bar graph depicting 49 proteins with higher abundance in the Cgyps1-11Δ secretome compared to the wild-type secretome. (C) Bar graph depicting 16 proteins with lower abundance in the Cgyps1-11Δ secretome compared to the wild-type secretome. The fold-difference in levels are presented as Log2 values.

