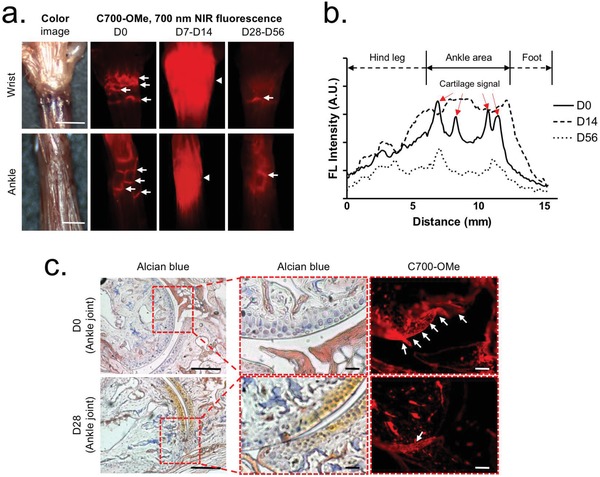
Figure 3.

In vivo cartilage imaging using C700‐OMe over the progression of RA. a) 25 nmol (0.05 mg kg−1) of C700‐OMe was injected intravenously into mice with CAIA 2 h prior to imaging of the cartilage in the wrist and ankle. Scale bars = 3 mm. Images are representative of independent experiments (n = 3). b) A line profile chart of fluorescence intensity in each stage. c) Alcian blue and NIR imaging of resected ankle tissue from (a). Scale bars = 50 µm. Red pseudocolor was used for 700 nm NIR images. Arrows indicate the articular cartilage linings.
