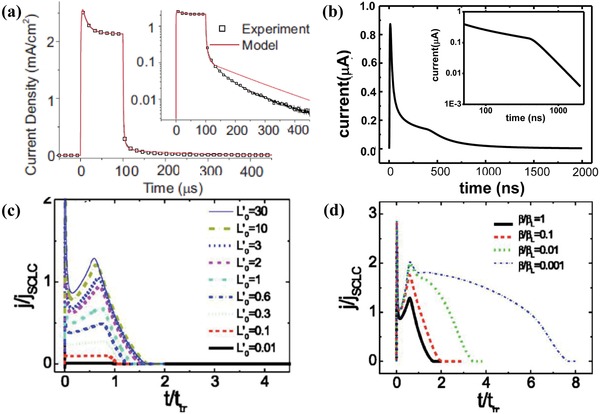
Figure 9.

The transient photocurrent response of devices. a) Comparison of the experimental (squares) and the calculated (line) microsecond transient photocurrent response after a light pulse. The inset displays these curves on a log‐linear plot highlighting the deviation between experiment and model at low photocurrent densities after turning off. The transient peak can be explained by the buildup of trapped electrons, and detrapping rate constant used of 2.2 × 10⁵ s−1 qualitatively reproduces the photocurrent tail after turning off the light pulse. Reproduced with permission.86 Copyright 2009, AIP Publishing. b) The simulated nanosecond transient photocurrent response of the device with traps after a light pulse. The inset displays the current on an in log–log scale, the hyperbolic shape is the result by the dispersion of the traveling charge packet in disorder material. c) Transient current as a function of light intensity. The numerically calculated transient photocurrent response with the intensity given in normalized units, t tr = d 2/µU 0. d) the numerically calculated transient current for various bimolecular recombination rate β/βL ratios. Reproduced with permission.87 Copyright 2005, American Physical Society.
