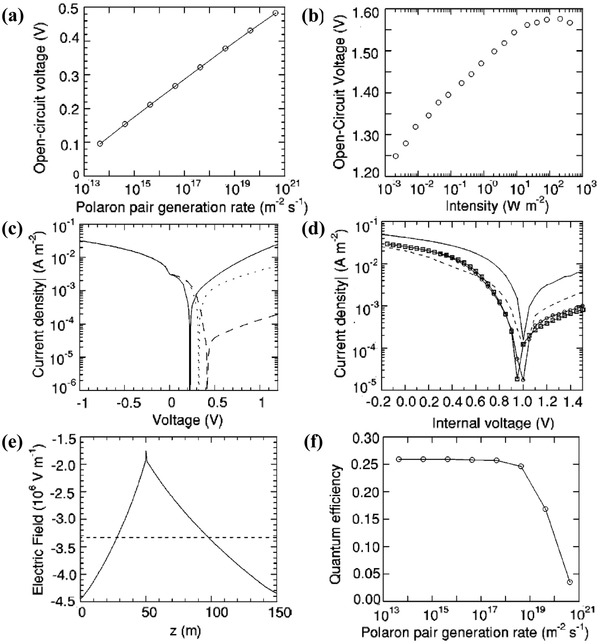
Figure 11.

The modeled and measured bilayer organic devices with exciton dissociation at the donor–acceptor interface. a) Open‐circuit voltage versus polaron pair generation rate with a lifetime τrec = 1 µs. A logarithmic dependence of V OC on intensity is reproduced over a wide range of intensities. b) Measured open‐circuit voltage for an ITO/PFB(50 nm)/F8BT(100 nm)/Al device as a function of incident intensity at 458 nm. The data shows a logarithmic dependence of V OC on intensity. c) Modeled current–voltage curves with τrec = 1 µs and a polaron pair generation rate of 4.3 × 10¹⁷ m−2 s−2. The anode barrier is 0.5 eV and the cathode barrier is 0.4 eV (solid line), 0.5 eV (dotted line), or 0.6 eV (dashed line). d) Measured current density versus internal voltage for ITO/PFB(50 nm)/F8BT(100 nm) cathode devices, under illumination at 459 nm with an intensity of 7 W m−2. The cathodes are gold (circles), copper (squares), chromium (solid) line, and aluminum (dotted) line. e) Modeled electric field versus position at −0.5 V with τrec = 1 µs, at polaron pair generation rates of 4.3 × 10¹⁷ m−2 s−2(dashed line) and 4.33 × 10¹⁹ m−2 s−2 (solid line). f) Quantum efficiency versus polaron pair generation rate at −0.5 V with τrec = 1 µs. Reproduced with permission.2 Copyright 2004, American Physical Society.
