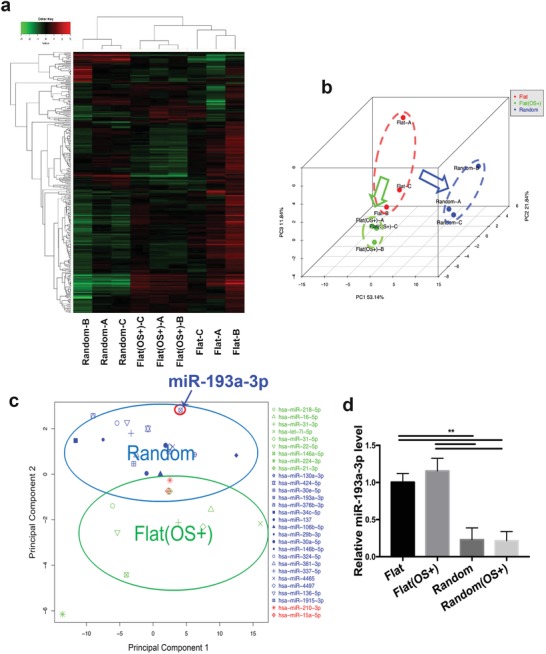
Figure 2.

Differential microRNA (miRNA) levels determined using miRNA microarrays and according to component distribution. a) Heatmap of hierarchical clustering and b) 3D PCA of miRNA levels in hBMSCs cultured on the flat, flat (OS+), and random substrates for 14 days. c) The 2D PCA of significantly downregulated miRNAs in the random and flat (OS+) group. d) miR‐193a‐3p levels in hBMSCs from the random, flat (OS+), and random (OS+) groups after 14 days in culture. Results are means ± SEM (n = 3). Samples were subjected to one‐way analysis of variance (ANOVA) with Tukey's post hoc test (*p < 0.05, **p < 0.01, ***p < 0.001).
