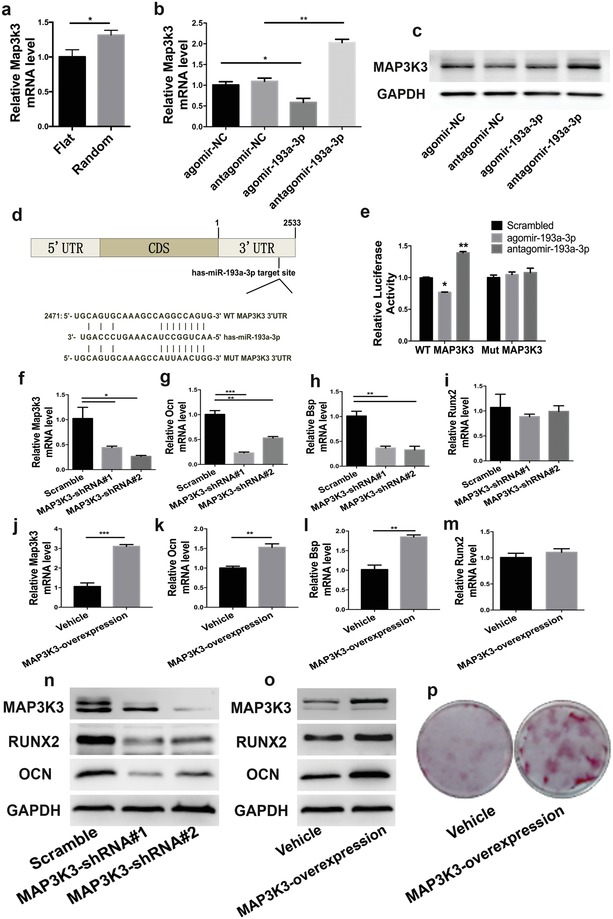
Figure 6.

miR‐193a‐3p directly targeted MAP3K3. a) Map3k3 mRNA expression levels of hBMSCs in the flat and random groups. b) mRNA and c) protein levels of MAP3K3 in hBMSCs treated with agomir‐193a‐3p, antagomir‐193a‐3p, and their corresponding scrambled controls. d) Schematic diagram of the design of luciferase reporters with the wild‐type Map3k3 3′UTR (WT MAP3K3 3′UTR) or the site‐directed mutant Map3k3 3′UTR (MUT MAP3K3 3′UTR). e) The effects of agomir‐193a‐3p, antagomir‐193a‐3p, or their corresponding scrambled controls on the luciferase activity of WT MAP3K3 3′UTR and MUT MAP3K3 3′UTR reporter in hBMSCs. f) Transfection efficiency of Map3k3‐small‐hairpin RNA (shRNA). g–i) mRNA levels of osteogenic genes in hBMSCs treated with MAP3K3‐shRNA. j) Transfection efficiency of the Map3k3‐overexpression vector. k–m) mRNA levels of osteogenic genes in MAP3K3 overexpressing hBMSCs. n). Protein levels of osteogenic factors in hBMSCs treated with MAP3K3‐shRNA. o) Protein levels of osteogenic factors in MAP3K3 overexpressing hBMSCs. p) Alizarin red staining of MAP3K3 overexpressing hBMSCs after 21 days of culture. Data are means ± SD (n = 3). *p < 0.05, **p < 0.01, ***p < 0.001.
