
Figure 7.
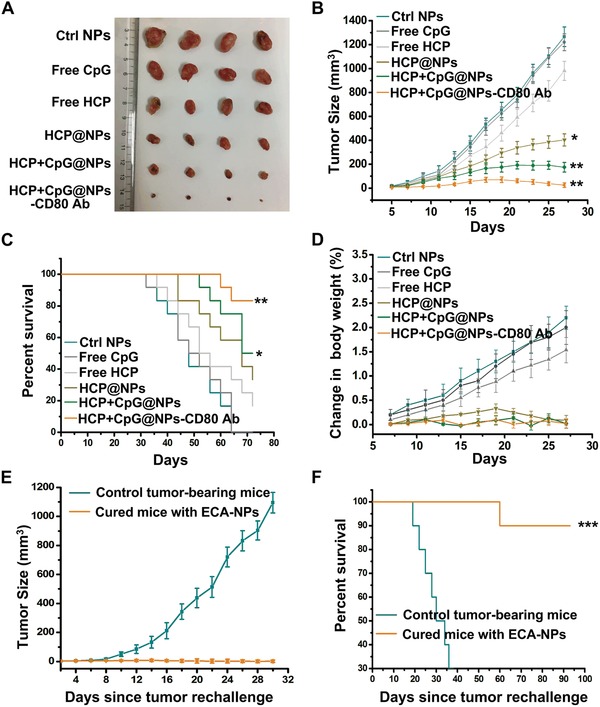
EAC‐NPs caused tumor regression. A) Representative images of 4T1 tumors collected from tumor‐bearing mice following 27 d of treatment as indicated. B) Tumor growth curves of tumor‐bearing mice treated with different modified NPs every two days over 27 d (n = 16). The data show mean ± SD. C) Survival curves of tumor‐bearing mice treated with different modified NPs (n = 12). D) Analysis of body weight change in tumor‐bearing mice in (B) (n = 8). E) Tumor growth curves of individual animals cured 90 d after EMT6 tumor inoculation using the EAC‐NPs and then rechallenged with EMT6 tumor cells (n = 14). Mice of the same age were inoculated with tumor cells as controls. The data show mean ± SD. F) Survival curves of tumor‐bearing mice in (E) (n = 10). Differences in survival were determined using the log‐rank test. *P < 0.05, **P < 0.01, and ***P < 0.001.