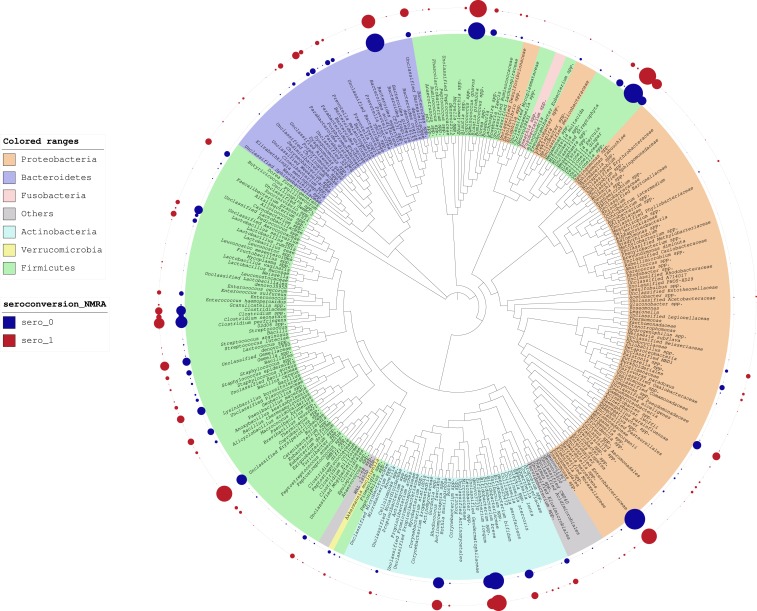
Figure 1.
Interactive Tree of Life analysis of relative abundance of bacteria comparing RV seroconverters vs. non-seroconverters. Relative abundance is depicted as the size of circles aligned with the noted bacterial taxa. Relative abundance of bacterial taxa among non-seroconverters and seroconverters is reflected in the inner blue and red rings, respectively.

