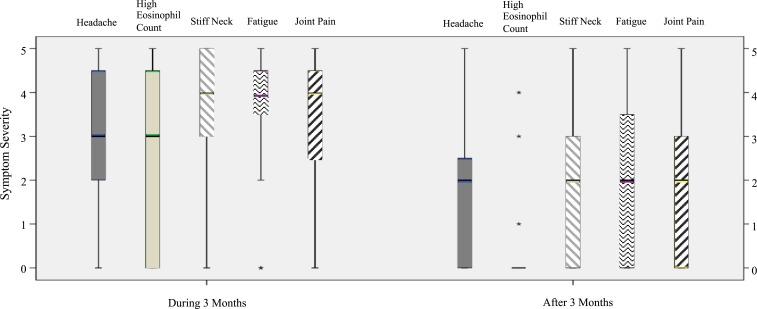
Figure 3.
A boxplot analysis displaying mean severity of symptoms in 15 clinically diagnosed participants found to be significantly different during and after 3 months of being infected with A. cantonensis. These clinically diagnosed symptoms had higher severity during 3 months of infection than 3 months post-infection. The lines are the severity spectrum, the bars represent most of the patients’ responses, and the cross between bars represents the medians. *Extreme outliers. This figure appears in color at www.ajtmh.org.

