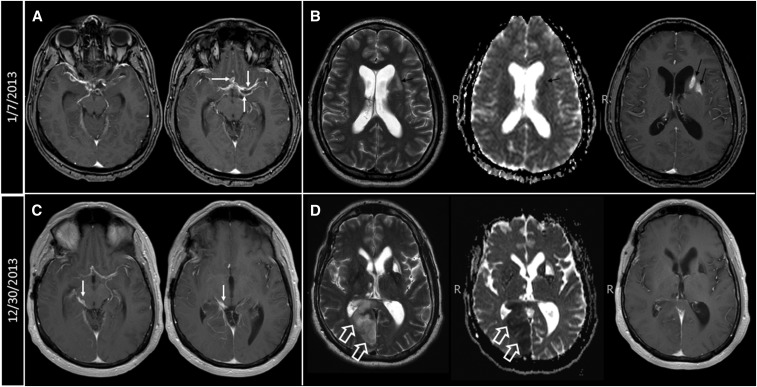
Figure 3.
(A) Postcontrast T1-weighted images showing abnormal enhancement along the courses of the MCAs and ACAs bilaterally with associated cystic changes (white arrows). (B) Axial T2, axial apparent diffusion coefficient (ADC) maps, and axial postcontrast T1-weighted images showing subacute infarcts in the left basal ganglia and centrum semiovale (black arrows). (C) Abnormal enhancement in the right side of the perimesencephalic cistern (white arrows) along the course of the right posterior cerebral artery (PCA). (D) Axial T2, axial ADC maps, and axial postcontrast T1-weighted images showing acute infarction in the right medial occipito-parietal region (white hollow arrows).

