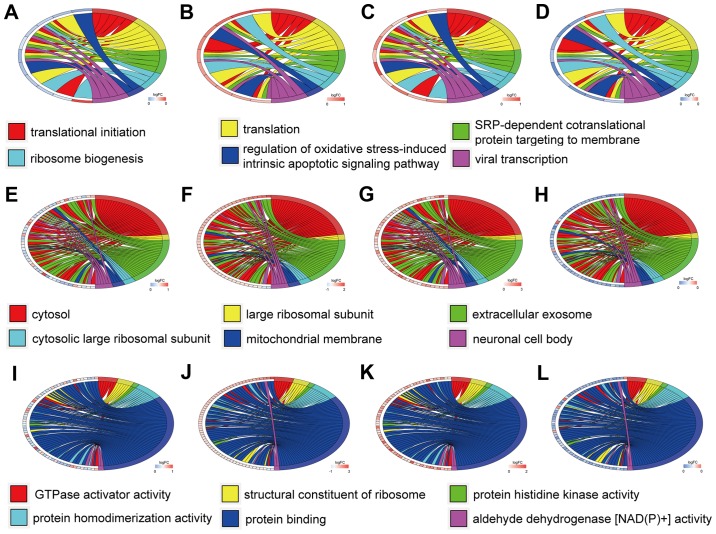
Figure 3.
Gene Ontology analysis of the hypomethylation-high expression genes. Chord plot revealing a circular dendrogram of the clustering of the expression profiles. Cluster revealing genes and their (A-D) assigned biological process, (E-H) cellular component and (I-L) molecular function terms are connected by ribbons. Blue to red on the left side of the chord plot represent logFC. Each color from red to purple on the right side of the chord plot represents a different term. A, E and I reveal the expression in the methylated GSE47915 dataset. B, F and J reveal the expression in the GSE55945 dataset. C, G and K reveal the expression in the GSE69223 dataset. D, H and L reveal the expression in the methylated GSE76938 dataset.

