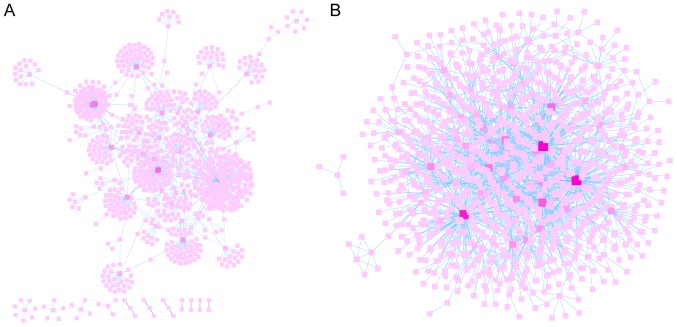
Figure 5.
PPI network of the aberrantly methylated-differentially expressed genes. (A) PPI network of the hypomethylation-high expression genes. (B) PPI network of the hypermethylation-low expression genes. The distribution degree of nodes is indicated by the color of the square blocks, and the darkness of the color indicates the significance of the nodes. PPI, protein-protein interaction.

