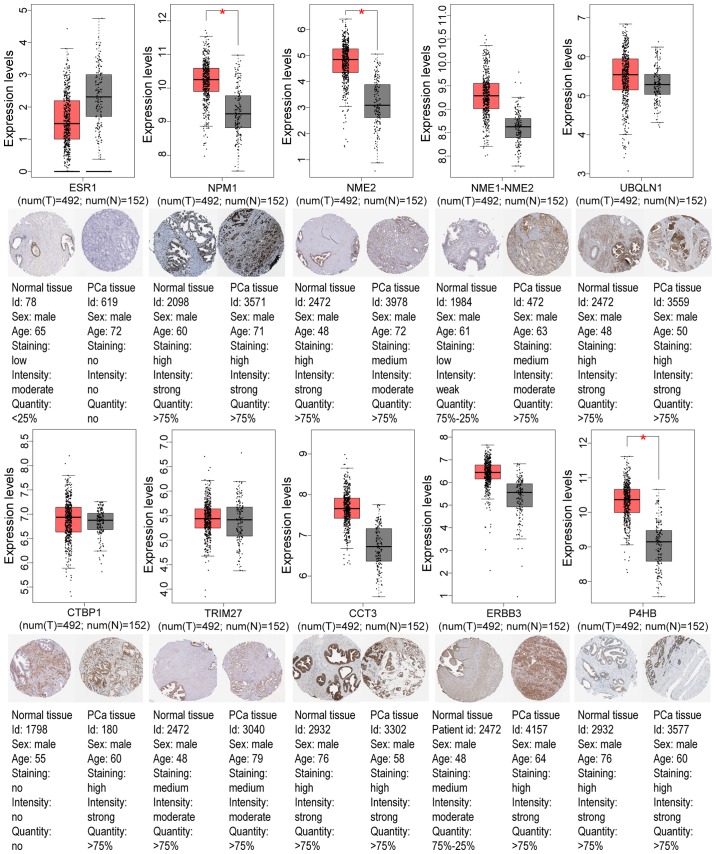
Figure 7.
Validation of the top ten hypomethylation-high expression genes. The boxplots reveal the expression levels of the top ten hypomethylation-high expression genes in PRAD tissues (n=492) and their corresponding normal samples (n=152) based on The Cancer Genome Atlas and Gene Expression Profiling Interactive Analysis databases. To express gene expression, on the y-axis, the log2(TPM+1) for log-scale was used. The red color was set for the tumor dataset. The red and gray boxes represent prostate tumor and normal tissues, respectively. The size of jitter across the box was set as 0.4. The staining patterns revealed immunohistochemical staining of these genes between PRAD samples and normal prostate samples. *P<0.05. PRAD, prostate adenocarcinoma; PCa, prostate cancer.

