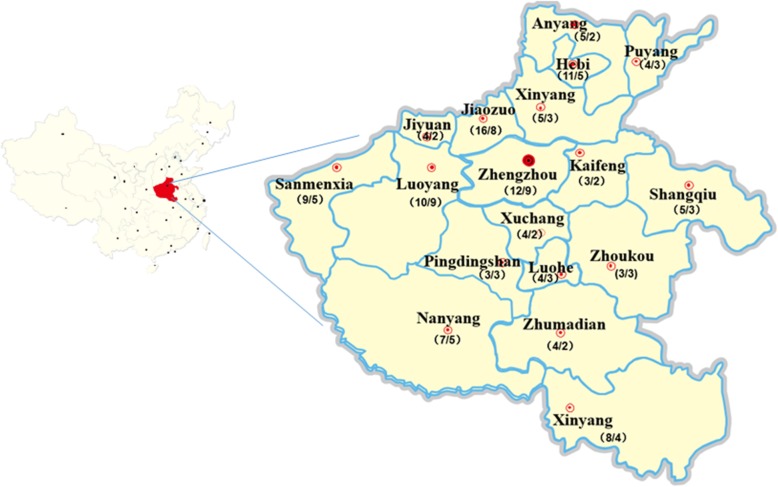
Fig. 1.
Geographical distribution and PCV2 test results of clinical tissue samples in Henan province from 2015 to 2018. The first number in parentheses represents the total number of samples detected in this area, and the latter number represents the number of PCV2 positive samples detected in this area. The map in this figure is my own

