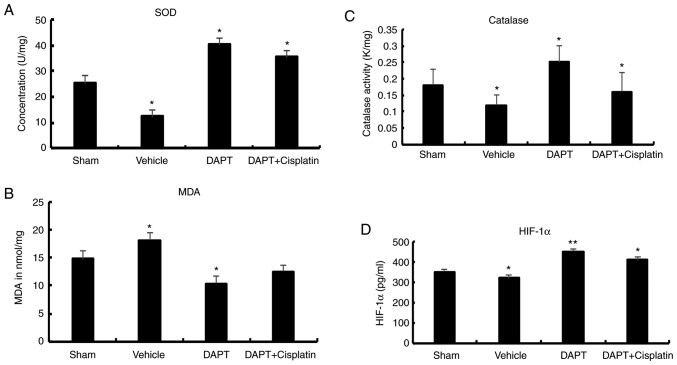
Figure 3.
Level of (A) SOD, (B) MDA, (C) catalase and (D) HIF-1a in streptozocin-induced diabetic rats. *P<0.05 and **P<0.01 compared with the sham group. SOD, superoxide dismutase; MDA, malondialdehyde; HIF, hypoxia-inducible factor; DAPT, N-[N-(3,5-difluorophenacetyl)-L-alanyl]-S-phenylglycine t-butyl ester.

