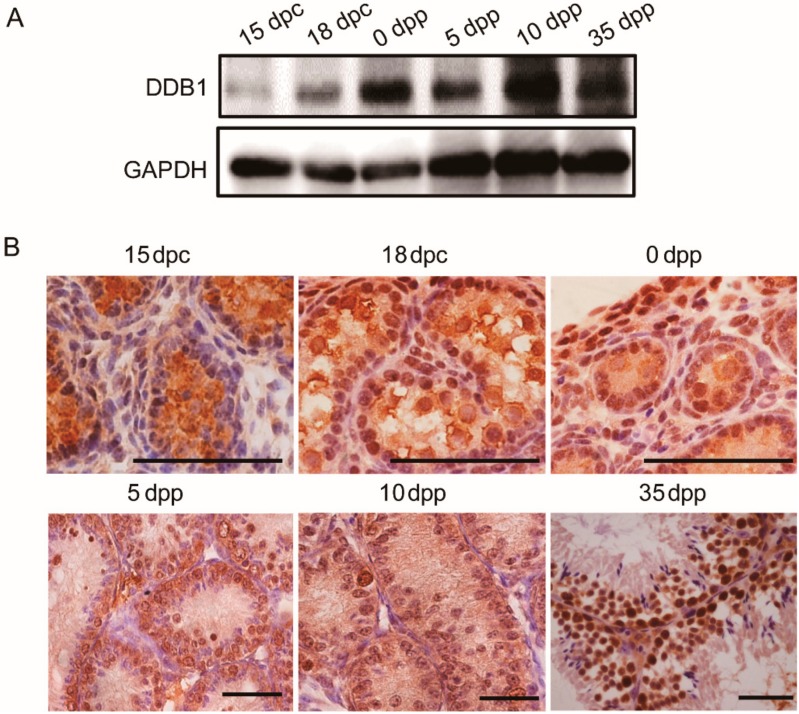
Figure 1.
Expression and localization of DDB1 in pre- and postnatal mouse testes. (A) A representative image shows DDB1 protein levels in mouse testes. GAPDH was used as loading control; (B) Representative images show cellular localization of DDB1 in testes at indicated ages. Brown represents DDB1 and blue represents nuclei and scale bars = 50 μm.

