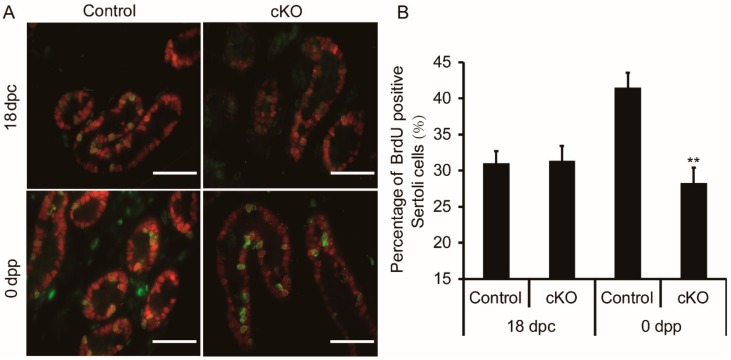
Figure 5.
Decreased Sertoli cell proliferation in neonatal Ddb1 cKO mice. (A) Immunofluorescence shows the proliferative (BrdU, green) and Sertoli cells (SOX9, red) in testes obtained from 18 dpc and 0 dpp mice, scale bars = 50 μm and (B) the percentage of BrdU-positive Sertoli cells shown in (A). Data were presented as mean ± S.E.M. ** p < 0.01, Student’s t-test.

