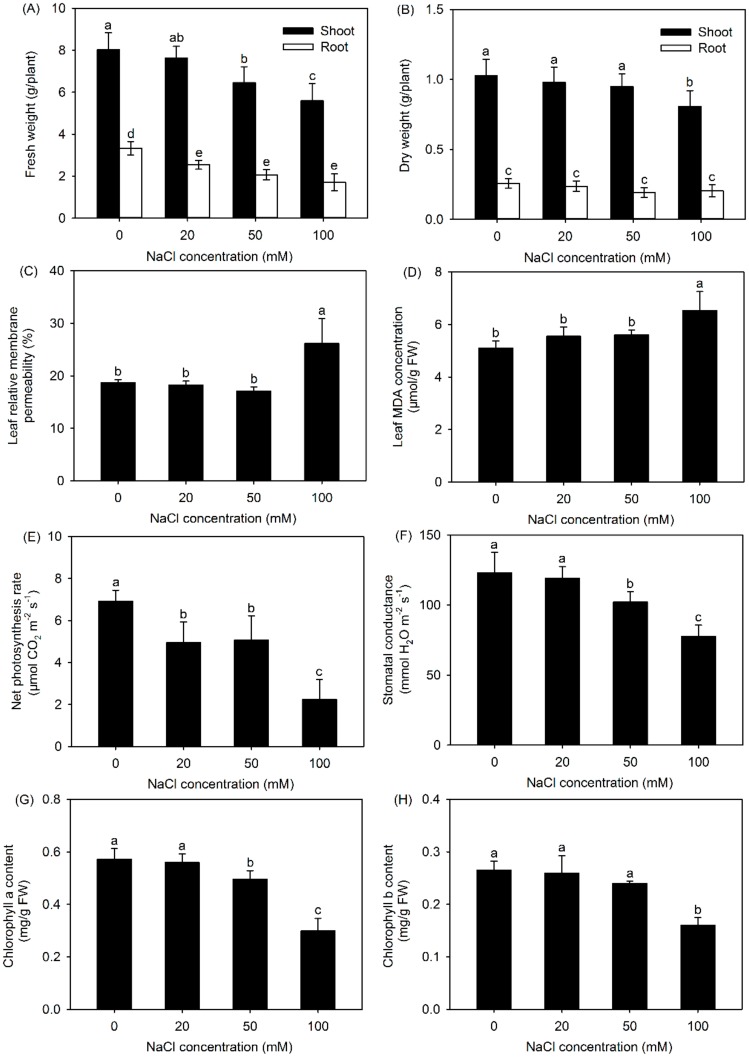
Figure 1.
Fresh weight (FW) (A), dry weight (DW) (B), leaf relative membrane permeability (RMP) (C), leaf malondialdehyde (MDA) concentration (D), net photosynthesis rate (Pn) (E), stomatal conductance (Gs) (F), chlorophyll a content (G), and chlorophyll b content (H) of P. cornutum exposed to 0, 20, 50, and 100 mM NaCl for seven days. Values are the means ± SDs (n = 6). Columns with different lowercase letters are significantly different at p < 0.05 (Duncan’s test).

