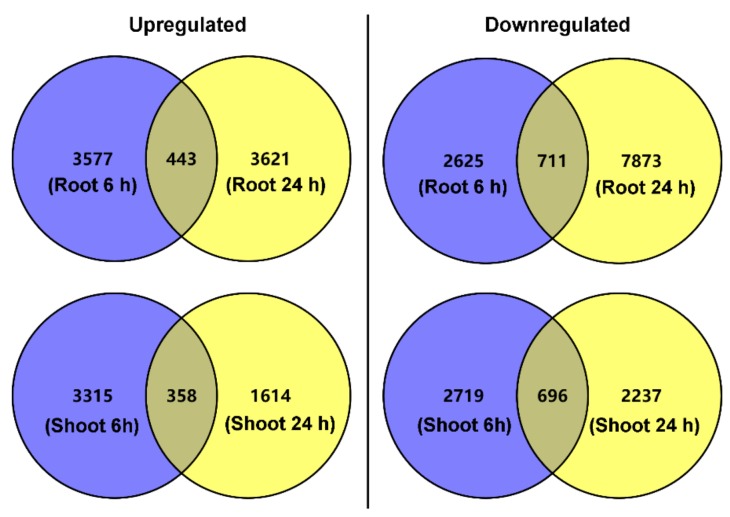
Figure 2.
Venn diagrams showing the total number of differentially expressed genes (DEGs) in roots and shoots of P. cornutum under 50 mM NaCl treatment for 6 and 24 h. The blue circles represent the number of upregulated or downregulated DEGs in roots or shoots exclusively under 50 mM NaCl treatment for 6 h. The yellow circles represent the number of upregulated or downregulated DEGs in roots or shoots exclusively under 50 mM NaCl treatment for 24 h. The overlaps between the blue circles and yellow circles represent the number of upregulated or downregulated DEGs in roots or shoots under 50 mM NaCl treatment for both 6 and 24 h.

