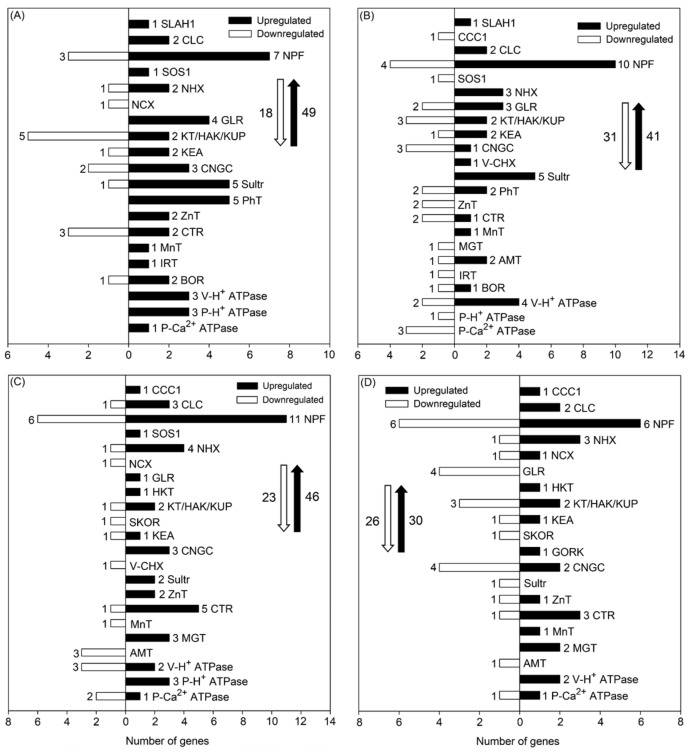
Figure 3.
Number of DEGs related to ion transport under 50 mM NaCl treatment for 6 and 24 h in roots ((A,B), respectively) and in shoots ((C,D), respectively) of P. cornutum. The white downward arrows and black upward arrows show the total number of downregulated DEGs and upregulated DEGs, respectively.

