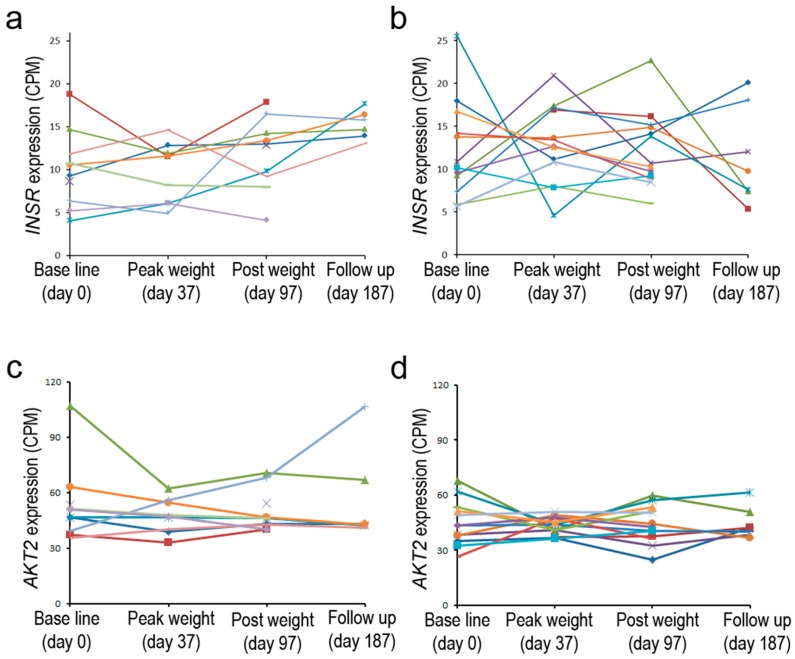
Figure 3.
INSR expression in non-insulin-resistant and insulin-resistant subjects. Steady-state levels of INSR or AKT2 mRNA observed in peripheral blood monocytes (PBMC) from (a,c) overweight to obese, non-insulin resistant and from (b,d) overweight to obese, insulin-resistant individuals during a course of weight gain and subsequent loss. Mean levels in baseline INSR levels (a,b) were similar in these two classes; however, there were more than >2X changes in the levels in the insulin-resistant category after a period of weight gain. AKT2 levels showed less variation in baseline levels and during weight changes for both of these groups (c,d) (data from [80]).

