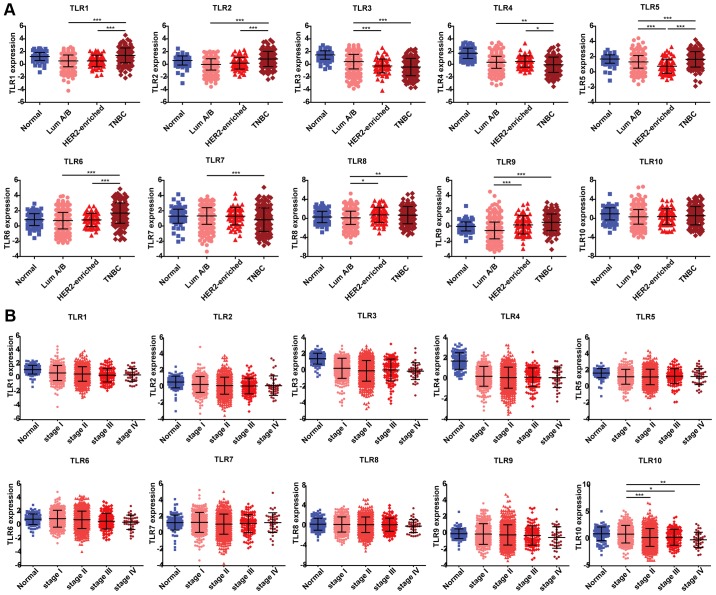
Figure 2.
TLR expression among different subtypes and stages of breast cancer. (A) Subtype information was exported from TCGA breast cancer database, including 113, 628, 67 and 142 samples from normal tissues, Luminal A/B, HER2-enriched and triple-negative subtypes, respectively. (B) TNM stage information was exported from TCGA breast cancer database, including 113, 279, 622, 131 and 40 samples from normal tissues, stage I, II, III and IV, respectively. Data are expressed as the mean ± standard deviation. One-way analysis of variance was used to evaluate the statistical significance of differential mRNA expression levels of candidate genes among groups. *P<0.05, **P<0.01 and ***P<0.001. TLR, Toll-like receptor; TCGA, The Cancer Genome Atlas; ns, no significant difference.

