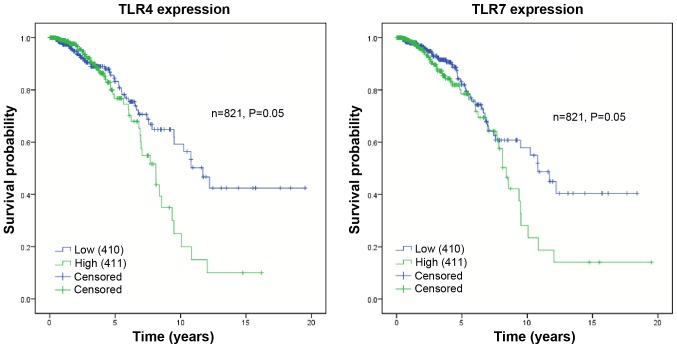
Figure 3.
Kaplan-Meier curves for overall survival stratified by TLR4 and TLR7 mRNA expression. The overall survival data was exported from The Cancer Genome Atlas breast cancer database, including 410 and 411 samples with low (blue lines) and high (green lines) TLR expression, respectively. Only cases exhibiting cancer-associated mortality were included in this analysis. The symbol + denotes censored observations. The log-rank test was used to compare the overall survival curves between groups. TLR, Toll-like receptor.

