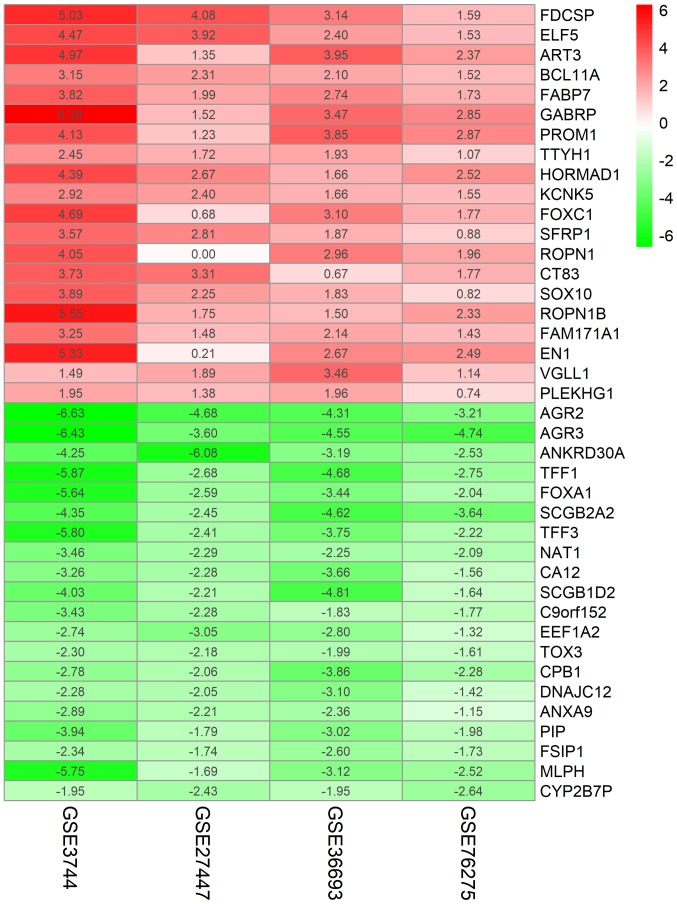
Figure 1.
Top 20 upregulated and downregulated genes in TNBC vs. non-TNBC. The red indicates increased gene expression, whereas the green indicates decreased gene expression; the number exhibited in the figure indicates the logarithmic fold change of genes in each dataset. TNBC, triple-negative breast cancer.

