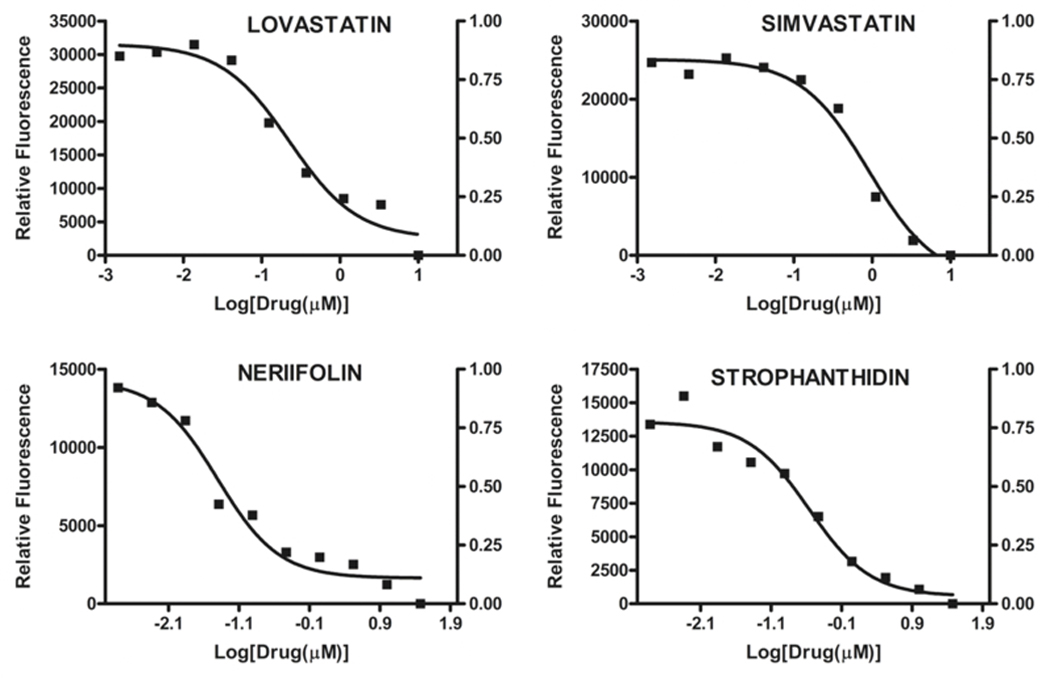
Fig. (1).

IC-50 estimation of selective hits from dose response curve. Reporter-expressing C6(1×10³ cells) and DLD1 cells (500 cells) were plated in multiple wells of several 384-well plates. 24 hours after seeding, the tested compounds were serially diluted 1:3 with complete medium by 9 times (for a concentration range from 30μM to 1.5nM). After 2 days’ incubation, the cell media was dumped, fluorescence was measured per well from the top by a plate reader. Each data point represents the average of a triplicate reading, data fit was carried out by GraphPad. The estimated IC-50 for Lovastatin and Simvastatin on C6 cells are 230nM and 900nM, respectively. Neriifolin Strophanthidin on DLD1 cells are 25nM and 250nM, respectively.
