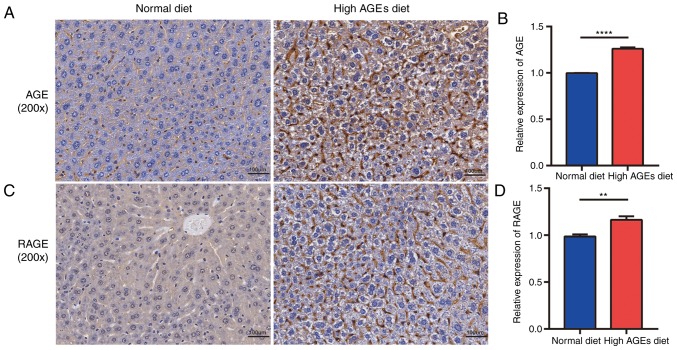
Figure 4.
Determination of the expression levels of AGE and RAGE in NASH model mice using immunohistochemical staining. (A) Representative micrographs (magnification, ×200) and (B) semi-quantification of the protein expression levels of AGE in liver. (C) Representative micrographs (magnification, ×200) and (D) semi-quantification of the protein expression levels of RAGE in liver tissues. Scale bars, 100 µm. **P<0.01 and ****P<0.0001. AGE, advanced glycation end-product; ND, normal diet; RAGE, receptor of advanced glycation end-product.

