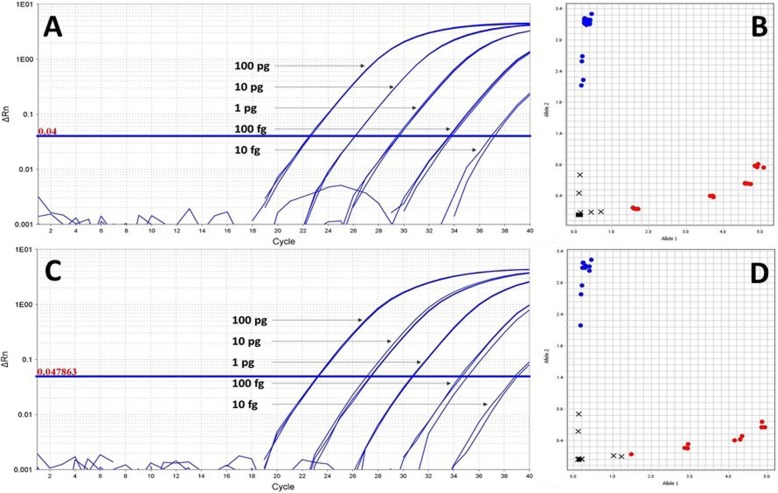
Fig. 3.
Real-time amplification plots of the 892 (a) and 1352 (c) rhAmp genotyping assays showing dilution curves of B. anthracis Sterne DNA. Ten-fold serial dilutions of Sterne DNA ranging from 10 fg to 100 pg were used to establish the limit of detection of each assay in triplicate (only fluorescence from Sterne specific allele primer is shown). Both assays consistently detected Sterne DNA at levels of 100 fg or higher but failed to produce consistent amplification with 10-fg samples. Similarly, a non-Sterne strain (Nigeria) exhibited a 100-fg limit of detection, with 10-fg samples producing sporadic amplification (data not shown). The corresponding endpoint allelic discrimination plots for the 892 (b) and 1352 (d) assays depict Sterne as red clusters and non-Sterne Nigeria DNA in blue. In both assays, non-Sterne DNA (blue clusters) is distinct from Sterne (red clusters). The genotypic separation of Nigeria DNA is achieved with as low as 100 fg, with 10 fg-samples being called undetermined (black X). Discrimination of Sterne is achieved with 1 pg of DNA in both assays (Panels b and d). Black squares near the plot origin represent negative controls. Undetermined calls are depicted as black Xs

