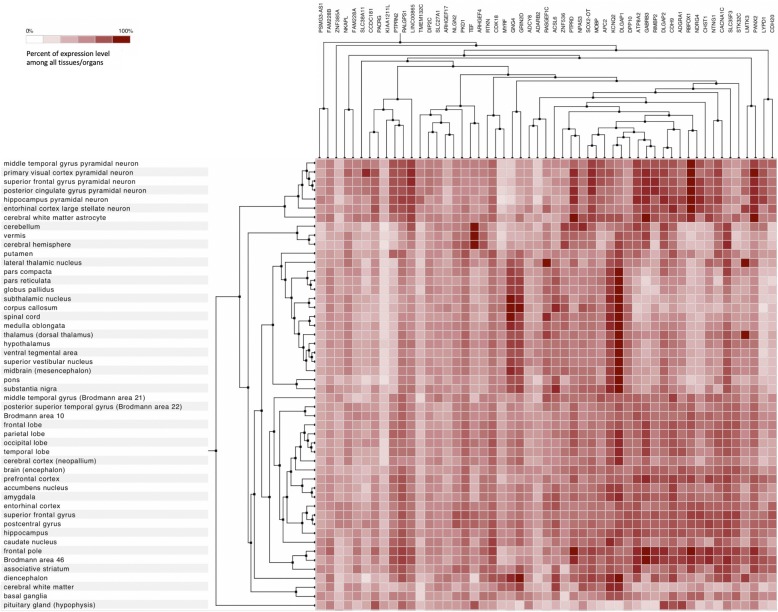
Fig. 3.
Brain-specific expression patterns for hypomethylated genes in Rahman syndrome. Gene expression profiles in brain tissues extracted from Additional file 2: Figure S2 (highlighted by the black square). Data are obtained from 65761 Affymetrix Human Genome U133 Plus 2.0 arrays in Genevestigator; hierarchical clustering is performed using Pearson correlation as similarity measure and optimal-leaf ordering

